In this article
Deviation in your labour bill
The labour bill is a downloadable report into an Excel spreadsheet. This includes an individual tab for deviation on your project.
The purpose of the 'Deviation' tab is to provide a powerful and easy way to understand reasons behind any differential between your current projected labour spend (accounting for any fluctuations) and your:
- Tender projections i.e. your budgeted labour costs when your project was accepted onsite, based on tendered rate build ups and tendered measures.
- Live projections i.e. your projected labour costs at completion, based on current rate build ups and current measures.
Your current projected labour spend is calculated by considering all your labour invoices approved to date (at the respective rates and quantities approved) plus any remaining balance needed (at the current rates in your rate build ups and measures in your bill of quantities). Differences may occur between this and your tender projections and/or live projections for a number of reasons, including:
- Value engineering during the post tender review process
- Scope changes, remeasure, add & omits and/or variations
- Using different subcontractors or fluctuating labour prices
- Under or over allowance for quantities at tender
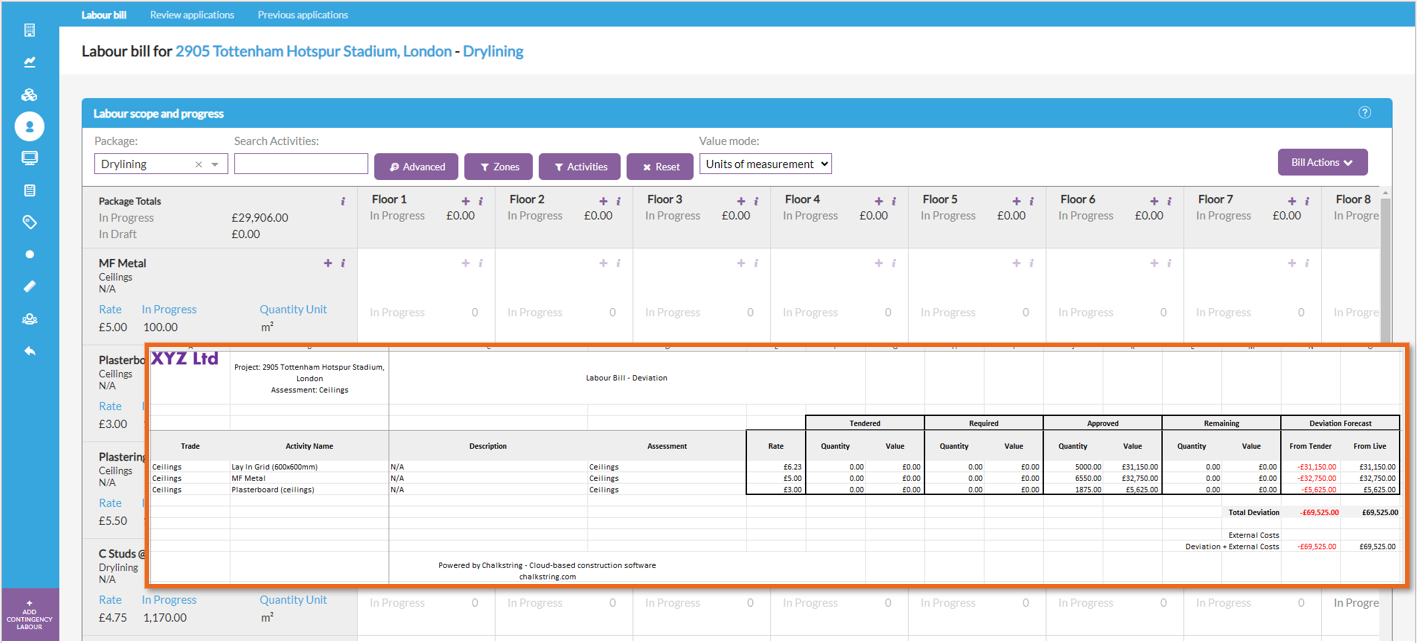
The 'Deviation' tab provides a clear breakdown of what was included in your tender, what’s currently required for the live project, what’s been approved so far and the remaining balance to be paid. For transparency every labour activity is broken down into separate lines so you can analyse the current status and track any changes, and labour activities are broken down as follows:
- The 'Tendered' columns show the total quantity and value of the labour included with the accepted tender.
- The 'Required' columns show the total quantity and value of the labour that is needed for the full assessment, based on current rate build ups and measures.
- The 'Approved' columns show the total quantity and value of the labour that has been approved to date.
- The 'Remaining' columns show the outstanding quantity and value of labour to completion.
The 'From Tender' column in the 'Deviation Forecast' shows any difference in value between your current projected labour spend (taking into account any fluctuations in labour rates etc) and your tender projections when the assessment was accepted onsite. Each labour activity is broken down across multiple rows if there are different rates used throughout the project, and at the bottom there is a total deviation value for the whole assessment. A negative total indicates a forecast overall saving versus your tender projections and a positive number indicates a forecast overall increase in spend versus your tender projections. By highlighting all the deviation for any one labour activity, you can see the total deviation across the project for that particular labour activity.
Similarly, the “From Live” column in the 'Deviation Forecast' shows any difference in value between your current projected labour spend (taking into account any fluctuations in labour rates etc) and your live projections based on your current rate build ups and bill of quantities. A positive total indicates an overall forecast overspend versus your live projections and a negative number indicates an overall forecast saving versus your live projections.
