In this article
- Project hub charts using white card rules
- Project Hub charts
- Actual & Accrued Costs table
- Want to know more?
Project hub charts using white card rules
Residential contractors can sometimes work under a contract that requires they only apply for payment of work once it is 100% complete. This is know as 'white card'. The white card function allows you to track progress and create an application based on a staged payment schedule. This feature is ideal if you do residential projects.
Project hub charts
When utilising white card, the 'Package Progress' bar chart, 'Tender Projections' (1) and 'Current Projections' (2) figures will be unaffected by white card implications. This is because white card essentially creates a cash flow issue due to the application values being artificially reduced from live progress, rather than result in an ultimate profitability issue.
For example: If projected at 20% margin and costs run in line with budgets, then provided they get paid in full eventually when it is complete, their final certified application should restore the predicted profit margin (to circa 20% in this example). However, during the job it is very likely to have been tracking below expectations on certified payment dates. This feature essentially defers some revenue until milestone progress levels are obtained, so it will reduce periodic profitability and back load the profit realisation to the end of the project.
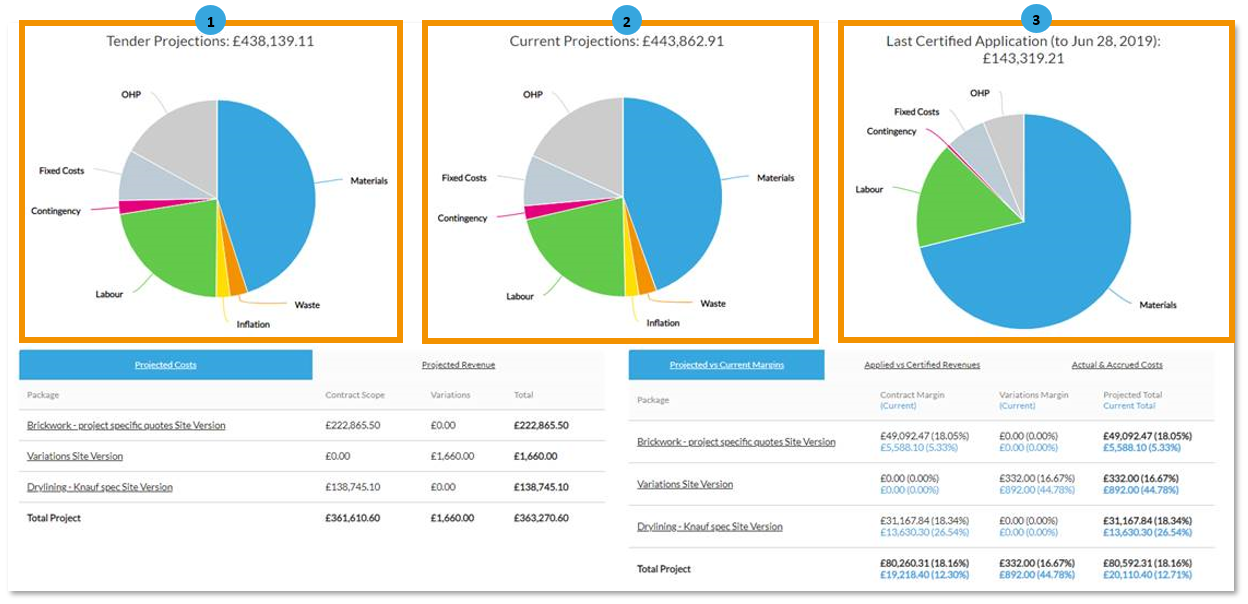
The last certified (3) is showing less OHP because of the white card rules. The revenue being claimed each period is lower than it should be based on progress, so materials etc you have bought and even used, which would normally have been accounted for in your revenue values, are still showing as disproportional high costs. Only when you get to the end of a job like this with the final payment would the OHP slice balance back up (providing all other things were equal – i.e. you delivered as planned).
It is very likely that users of white card applications will see lower than expected profits on their 'Last Certified Application' pie chart and 'Dashboard' margin graph until they reach the end of a job. The reason for this is that they are receiving revenue later than they would under progressive progress applications, but their costs are still going to be based on progressive progress up to effective dates. Suppliers and labour will not wait to be paid anything until the whole item it relates to is complete, as they have no control over this.
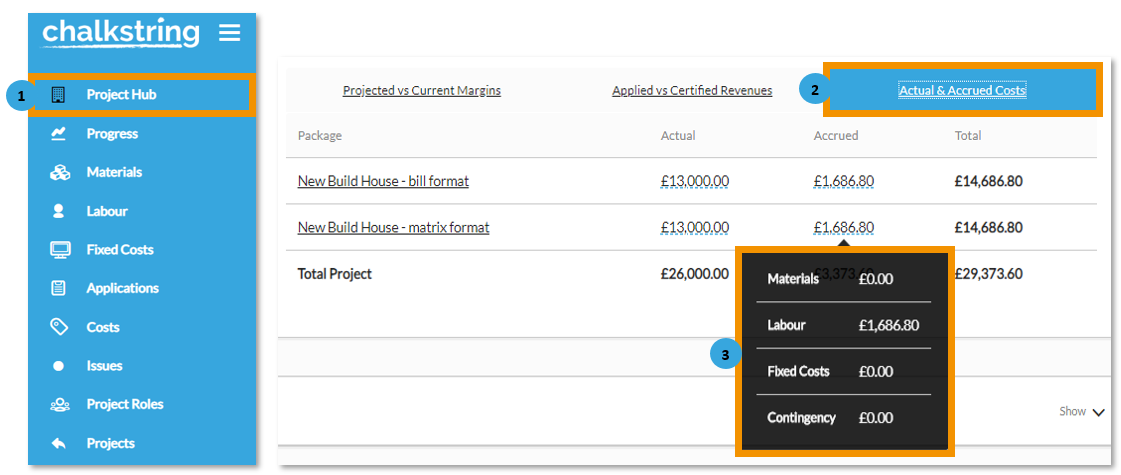
Actual & Accrued Costs table
This table allows you to view a breakdown of cost budgets by materials, labour, fixed costs and contingency values for actual and accrued costs.
- When you first login to Chalkstring, click the 'Project Hub' button for the project. This takes you to the blue menu.
- Within the 'Project Hub', scroll down and select the 'Actual & Accrued Costs' table. In this example, there is an accrual of £1,686.80.
- To view how the accrual came to this value, simply hover your mouse over the value and you can see that it comes from the labour budget.
To justify this figure, go to the 'Labour bill' and look at the detail of work in progress by each activity which adds up to achieve this accrued value