In this article
- Project hub overview
- Access the project hub
- Project status and dates
- Package progress graph
- Pie charts
- Commercial data tables
- Files & links
- Want to know more?
Project hub overview
Once a tender has been accepted, project information is copied into a live, onsite view of the project. The ‘Project Hub’ shows the onsite view of the project and displays all of the key metrics for the project, in real time.
This area is an essential for people in roles such as:
- Directors – to track and review project progress and view commercial reports.
- Quantity Surveyor – for performing a post tender review, log progress and create applications.
- Site Manager – to order materials and add labour applications.
- Site Admin – to add people or other costs to the project.
Access the 'Project hub'
- View the projects list in the black menu.
- Select the 'Project Hub' button for the relevant project, this takes you to the blue menu which holds information and menu options when working onsite with your live project.
Whether you have only one work package or multiple ones, the Project Hub pulls in all the information regarding work packages for the onsite project. This information is displayed through graphs, charts and tables to help you to evaluate what was allowed for during estimating, make comparisons, view revenues, make adjustments to costs and add in any variations.
Project status and dates
- When the project is taken onsite, the status will be 'open'.
- Programme dates can be defined by adding 'start onsite' and 'complete onsite' dates. Project Hub information is based on these project dates and by default, this is set to whatever date is specified in the Zones in the BoQ relating to each package. If there are no dates set in the zones then the system will use the dates based on what has been set in the project details at the top of this page.
Setting these dates in the assessment bill of quantity zones to reflect your build programme will help to benchmark the time progress for the overall project.
'Package progress' graph
The ‘Package Progress’ graph automatically compares the progress data for each package of the project as it relates to, revenue, costs and time.
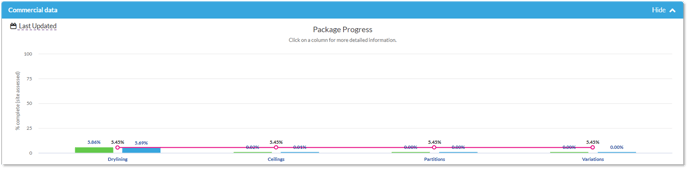
The green bar represents revenue progress. This is determined when progress is logged in the 'Progress' section.
The blue bar represents cost progress. This is determined by costs incurred as a result of ordering materials, equipment, paying labour or other external costs which have been booked to the project using Chalkstring.
The pink line represents time progress. This is determined from the programme dates set in the zones within each package bill of quantities. If you did not set programme dates by zone, this will default to the overall project programme dates.
- By hovering your mouse over a bar or the time line, pop ups will appear to present a breakdown of information.
- Click on a bar to drill down and view further information relating to revenues and costs.
Pie charts
Further down, you have 3 pie charts representing tender projections, current projections and certified applications, giving you a holistic view of what’s happening on the project, broken down into its constituent parts.
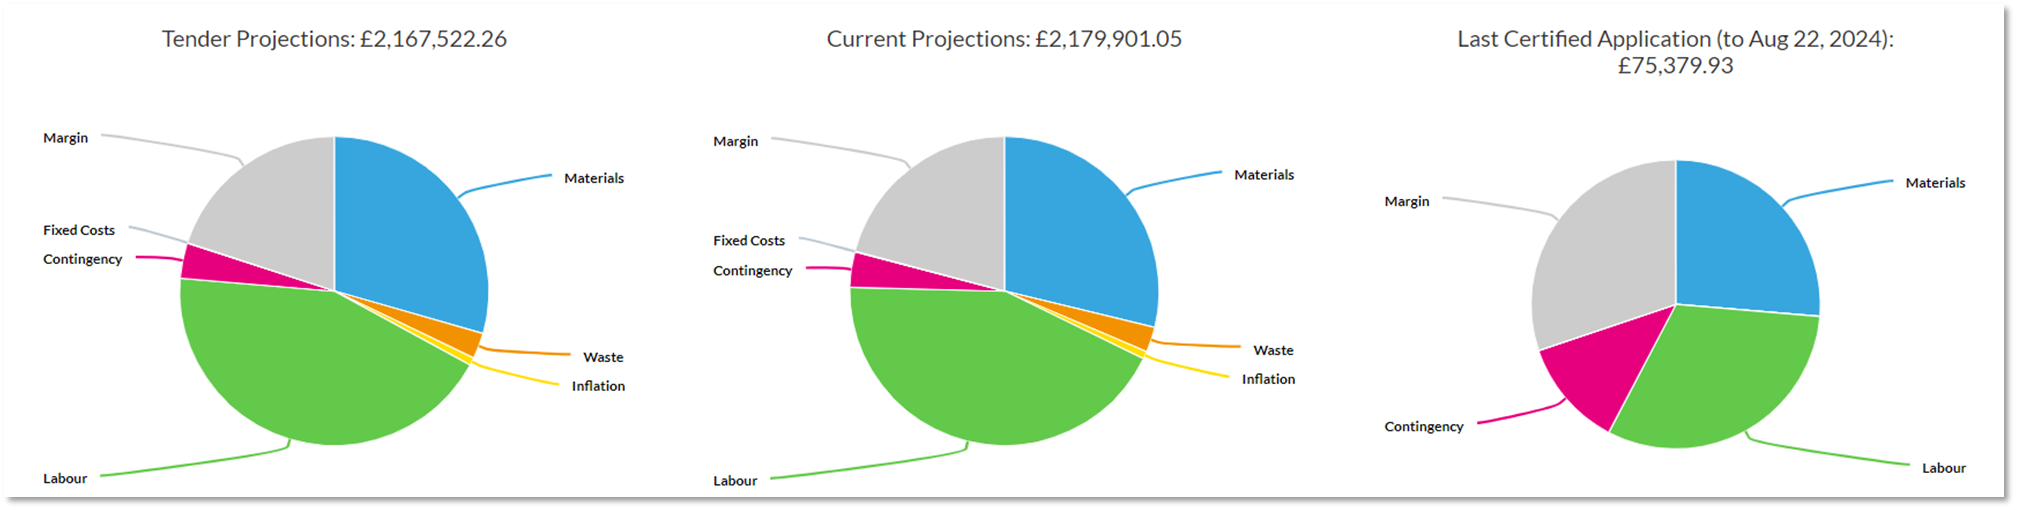
Tender projections - This chart reflects the project at the point of tender. It is made up of different packages which add up to the total. Packages may have been tendered at different times, Chalkstring will accumulate them all together for one project set of figures.
Current projections - This chart reflects the project value at this current time. With the addition of variations, the value has increased and more profit can be extracted from the project. Now that the project is onsite, we need to re-factor rates and prices to get the best pricing.
Last certified application - This chart reflects the revenue, cost and margin figures, as they relate to the most recent certified payment notice. This shows actual revenue vs actual & accrued costs incurred up to the end of the period covered by the application effective date.
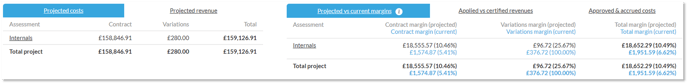
Commercial data tables
The commercial summary tables combine all the key information relating to costs, revenues, margins and payments for all packages. Click on the different titles to cycle through the display options.
You can access the assessment overview, rate build up, bill of quantities and fixed costs by clicking on the package name.
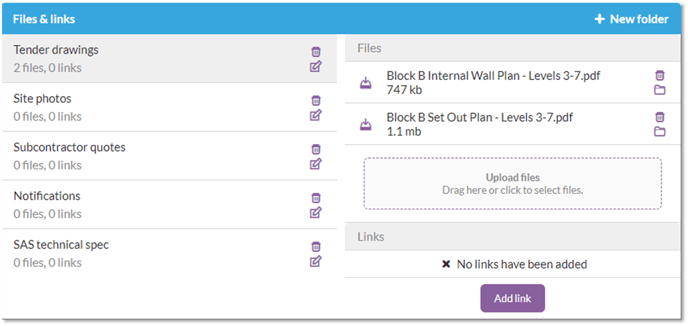
Files & links
Any data that was attached to the project at tender stage, will be already available here in the ‘Project Hub’. Using the ‘Files & links’ tab, you can add new folders, upload additional data, and manage the data in each folder.