In this article
Deviation in your material bill
The material bill is a downloadable report into an Excel spreadsheet. This includes an individual tab for devotion on your project.
The total deviation values from live and tender are also displayed in the 'Assessment summary' section of the onsite 'Assessment overview' page.
The purpose of the 'Deviation' tab is to provide a powerful and easy way to understand reasons behind any differential between your current projected material spend (accounting for material prices fluctuations) and your:
- Tender projections i.e. your budgeted material costs when your project was accepted onsite, based on tendered rate build ups and tendered measures.
- Live projections i.e. your projected material costs at completion, based on current rate build ups and current measures.
Your current projected material spend is calculated by considering all your materials ordered to date (at the respective prices paid and quantities ordered) plus any remaining balance needed (at the current prices in your rate build ups and measures in your bill of quantities). Differences may occur between this and your tender projections and/or live projections for any number of reasons, including:
- Value engineering during the post tender review process
- Scope changes, remeasure, add & omits and/or variations
- Changing suppliers or using multiple suppliers
- Fluctuating material prices
- Swapping materials
- Under or over allowance for quantities at estimate stage
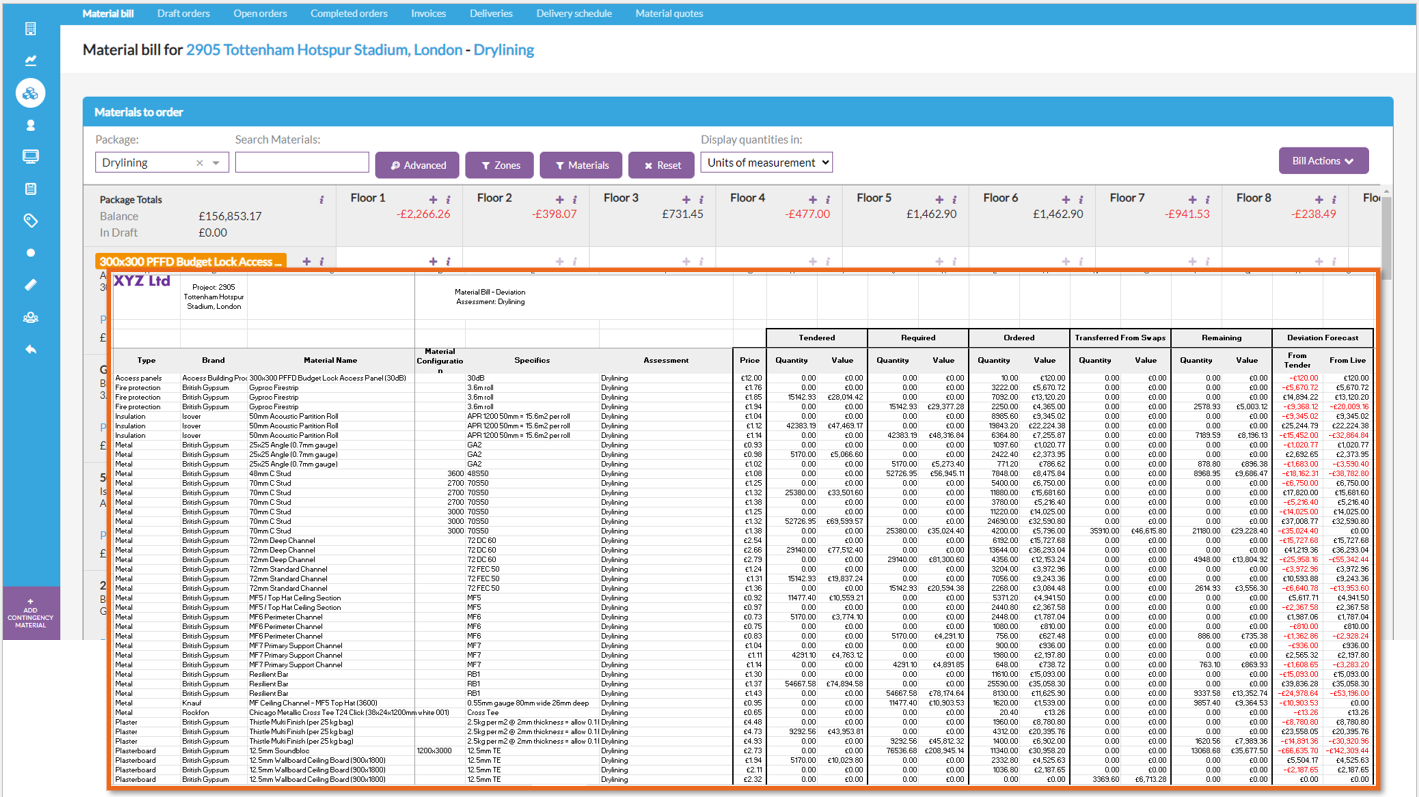
The 'Deviation' tab provides a clear breakdown of what was included in your tender, what’s currently required for the live project, what’s been ordered so far and the remaining balance to be ordered. For transparency every material is broken down into separate lines so you can analyse the current status and track any changes, and materials are broken down into quantity and value for each of the following:
- The 'Tendered' columns show the total quantity and value of the material included with the accepted tender.
- The 'Required' columns show the total quantity and value of the material that is needed for the full assessment, based on current rate build ups and measures.
- The 'Ordered' columns show the total quantity and value of the material that has been ordered to date.
- The 'Remaining' columns show the outstanding quantity and value of the material that needs to be ordered.
The 'From Tender' column in the deviation forecast shows any difference in value between your current projected material spend (taking into account any material price fluctuations etc) and your tender projections when the assessment was accepted onsite. Each material is broken down across multiple rows if there are different prices used throughout the project, and at the bottom there is a total deviation value for the whole assessment. A negative total indicates a forecast overall saving versus your tender projections and a positive number indicates a forecast overall increase in spend versus your tender projections. By highlighting all the deviation for any one material, you can see the total deviation across the project for that particular material.
Similarly, the 'From Live' column in the 'Deviation Forecast' shows any difference in value between your current projected material spend (taking into account any material price fluctuations etc) and your live projections based on your current rate build ups and bill of quantities. A positive total indicates an overall forecast overspend versus your live projections and a negative number indicates an overall forecast saving versus your live projections.
Finally, the 'Transferred From Swaps' columns keep track of any materials that are swapped mid-contract. When swapping materials, Chalkstring automatically creates and uses an internal system of "credits" in the background to adjust the numbers and ensure that swapped materials aren’t incorrectly classified as contingency. When swapped:
- The new material receives a credit or “balance transfer” equal to the quantity/value of orders placed for the old material. This is used along with new material’s order totals to calculate the remaining balance to prevent over ordering and therefore contingency as a result of the swap.
- Simultaneously the old material receives a credit or “order transfer” equal to the quantity/value of orders placed for the old material. This prevents the previously placed orders from being classed as contingency, even when there is no longer any requirement for this material in scope.
These two credits are shown in the deviation analysis so you can see a clear trail of how materials have been swapped during the contract and how these credits have been calculated.
Deviation information key points - advanced
Below you will find more advanced details on key areas of deviation details throughout Chalkstring.
Assessment summary deviation
Whilst the deviation details shown on the exported material and labour bills display their respective deviation details split out respectively , the deviation totals displayed in the 'Assessment summary' section of the 'Assessment overview' page of an onsite assessment, show the combined deviation totals for both materials and labour.

Deviation on spreadsheet vs deviation on assessment summary
You may on occasion see a small difference in the total tender deviation on the exported bills versus what is displayed on the assessment summary. The reason for this is due to necessary differences in the calculations of how the totals are reached in the spreadsheet and summary page.
- The measured costs figures on the assessment overview are the total figures from the price of products in the rate build up, multiplied by the zone quantities. To reach these totals, each product is broken down into it's separate cost budgets, materials, waste, labour, fixed costs & inflation, and these categories are rounded to the nearest penny. The result of this is the figures for each of the budgets on the assessment has been calculated by each of the products individual budgets cost component, multiplied by its total required quantity.
- The deviation on the spreadsheet is calculated by each specific materials combined total requirement multiplied it by its rate.
The resulting factors of these two slightly different calculations may result in small differences between the two for larger value projects.
Deviation contingency and inflation on assessment summary
