In this article
Logging progress
Once a project is onsite, one of the key activities that will be undertaken on a regular basis is updating site progress. This is essential so you can benchmark your incurred costs, establish your current application revenues and provide your clients with a detailed report of progress by package and zone, all of which can be compared against the programme time duration.
Chalkstring links key onsite functionality together through progress by using a slick and unique interface for keeping information up to date. Log progress from a mobile device whilst onsite by using simple sliders with all the calculations taking place in the background. Chalkstring will even automatically calculate your material onsite, by comparing your current progress vs what you have ordered to date.
At the start of each project package, in respect of measured works, you need to decide whether you wish to:- Update progress of all products individually (Progress by product) - This gives maximum accuracy and is recommended for lower volume / higher value workloads.
- Update progress of all products via a small number of groups (Progress groups) – This gives maximum speed and is recommended for higher volume / lower value workloads.
- Update progress via a combination of products and groups – This is a balanced trade-off between accuracy and speed to suit your business requirements.
Progress by product
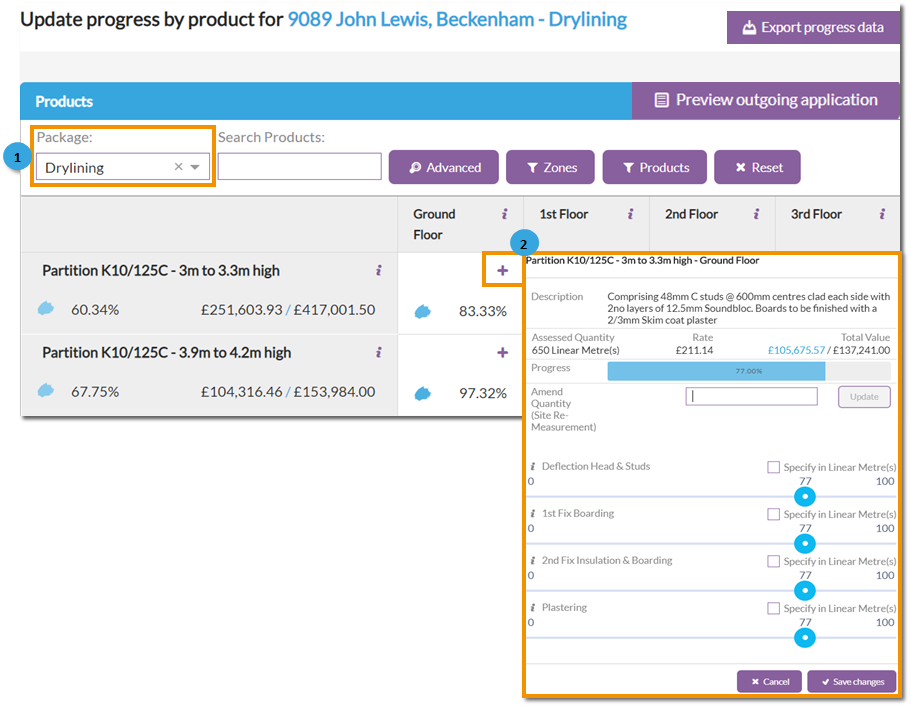
When 'Progress' is selected from the main blue menu, the default area is 'Progress by product'.
1. Select the relevant work package to log progress. You will be presented with a filterable and searchable list of all the items of work in your current defined scope. You can search them by package, zone and product name
2. Click on the '+' for the product you wish to record progress and view the following information:
- The product name and zone.
- The product description.
- Quantity - The assessed quantity of this product in this zone (as entered in the current bill of quantities).
- Check these are all correct - this is what you intend recording progress for.
- The rate - The current rate for the product
- Total value - Blue number reflects current value based on logged progress/black number is the overall total value for the product.
- Progress bar - Reflects overall progress for the whole product.
- 'Amend quantity' - Allows updates / re-measures of site measures to be added as you go round site without having to go back into the bill of quantities.
Quantities updated in the 'Progress' section will display a yellow flag on the 'Bill of quantities' page to highlight where the originating quantity has come from.
- Component progress sliders - Use the % slider to log actual progress for each component whilst going around site. Each zone is updated for ultimate accuracy and to give you the most accurate real time financial reporting possible.
The progress sliders display the measure of the product, as you move the slider along, the measure will move along. This allows you to quickly move the slider to an approximate % based position, or accurately move the slider to an exact measurement you have taken onsite. Clicking the tick box above each slider allows progress to be updated per unit of measure for the product, rather than as a percentage. Each component of the product will most likely have a different cost & value within the overall product.
For example, a 2-stage product like a suspended ceiling is not split 50/50 in costs and values. Move the component sliders to the correct positions, Chalkstring will then automatically calculate the overall product progress based on proportional weighting.
Repeat this process for every product you wish to update in every zone you are currently working in. The cumulative effect of these slider movements will establish the position of your project.
Each zone will display a coloured dot to highlight the level of progress currently marked for the product in each zone. Below each product will be a coloured dot which will highlight the overall level of progress for the product across the whole project.
- Red - No progress marked
- Blue - Some progress has been marked as complete. The darker the blue, the higher the level of progress completed.
- Green - Progress marked as 100% completed.
Progress data can be exported by clicking 'Export progress data'
To see a breakdown of the effects progress updates have made on any future applications can be viewed by clicking 'Preview outgoing application'.
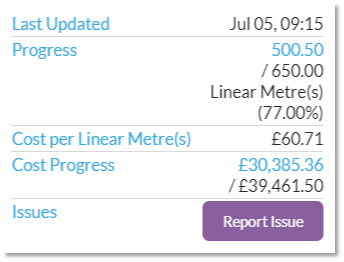
Issues
If you find any issues relevant to the work scope item whilst updating your progress, you can log them directly from this section. The issue will automatically be associated with the work for the zone. Issues can be anything your business decides it wants to monitor, such as snagging, health & safety, variations, progress photos etc.
To log an issue, from the update progress windows, click on the 'i' button above the component slider for the relevant component you wish to log an issue for and click 'Report Issue'.