In this article
Last certified application pie chart
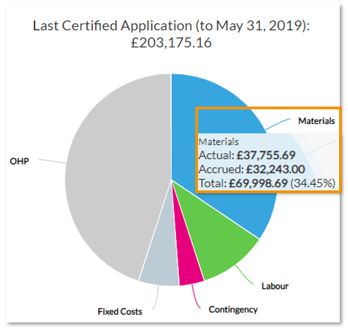
The 'Last Certified Application' pie chart is found within the Project Hub. It displays information based on the last application made (see the date in brackets) and the amount certified by your client. This article explains how these figures in this chart are derived.

Materials
Export accounts information
1. These figures can be reconciled by navigating to the 'Orders' section of the 'Accounts' menu in the black offsite side of Chalkstring and viewing the material orders.
2. Use the filters to refine the order information by 'date created' so that they match those of the last certified application, filter the 'Type' by 'Material' and filter the status by 'approved'.
3. You will also need to check the 'External costs' section to check if any material elements have been involved. In this example, there are no external material costs.
4. Once the filters has been applied, click the export button in the top right corner to export this information into excel.
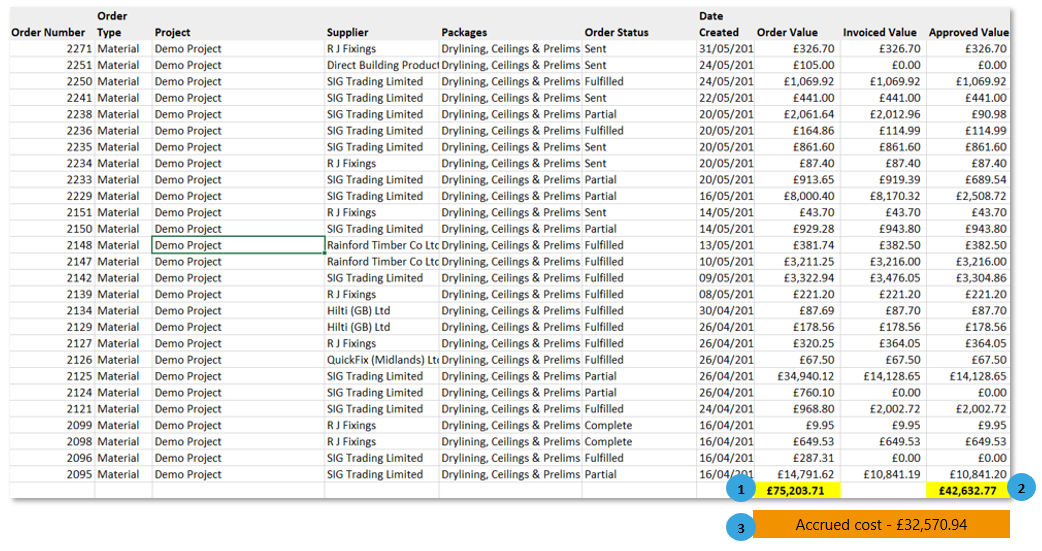
5. Example exported table below shows:
Check the figures
1. Total order value (for the period 16/04 - 31/05) £75,203.71.
2. Actual cost £42,632.77 (Actual approved value of material order invoices & external costs).
3. Therefore the accrued cost = £32,570.94.
Cross check actual costs
The 'Last Certified Application' chart shows - actual costs of £37,755.69.
The exported accounts table shows - actual cost £42,632.77.
This means there is a difference of £4,877.08. This difference must represent materials procured from the contingency budget i.e. outside the scope of the rate build ups for this package.
The accrued figure is the difference between the ordered and approved values in relation to material orders.
This is a prediction rather than actual manifest fact based on best information at the time, therefore this figure cannot be scrutinised further.
Labour

Export accounts information
1. These figures can be reconciled by navigating to the 'Labour applications' section of the 'Accounts' menu in the black offsite side of Chalkstring and viewing the labour applications.
2. Use the filters to refine the order information by 'effective date' so that they match those of the last certified application and filter the status by 'approved'.
3. You will also need to check the 'External costs' section to check if any labour elements have been involved. In this example, there are external labour costs.
4. Once the filters has been applied, click the export button in the top right corner to export this information into excel.
5. Example exported tables below show:
Labour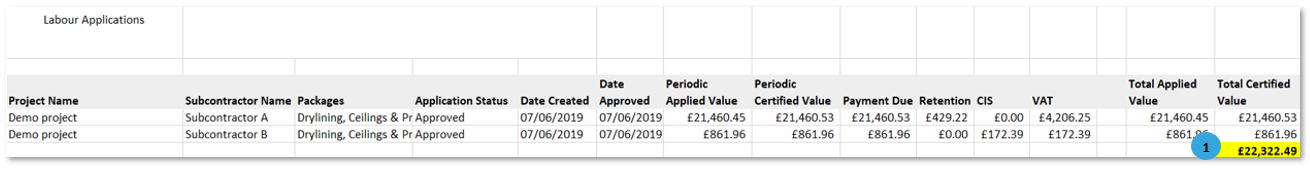

Check the figures
1. Total Certified value £22,322.49
2. External costs for labour £466.00
Cross check labour
he actual approved value of labour applications & external costs £22,788.49.
The 'Last Certified Application' chart shows - actual labour spent £21,363.43.
This means there is a difference of £1,425.06. This difference must represent labour paid out from the contingency budget.
The accrued figure is the difference between the ordered and approved values in relation to material orders.
The accrued figure is disregarded for reporting periodic certified figures. As labour applications should all have been processed long before a client payment certificate is received, accruing the WIP beyond your labour approvals would distort things simply because you would have allowed for something you haven’t incurred.
Fixed costs
The fixed costs section in this chart shows actual, accrued and total costs.
Actual fixed costs: £12,358.49

The fixed costs values displayed in the project hub show calculated daily costs for any fixed cost. For more on fixed cost daily calculations, see article Understanding the automated cost updates for Fixed-Cost orders
Export accounts information
1. These figures can be reconciled by navigating to the 'Orders' section of the 'Accounts' menu in the black offsite side of Chalkstring and viewing the fixed cost orders.
2. Use the filters to refine the order information by 'date created' so that they match those of the last certified application, filter by type 'Fixed cost' and filter the status by 'approved'.
3. You will also need to check the 'External costs' section to check if any fixed cost elements have been involved. In this example, there are external fixed costs.
4. Once the filters has been applied, click the export button in the top right corner to export this information into excel.
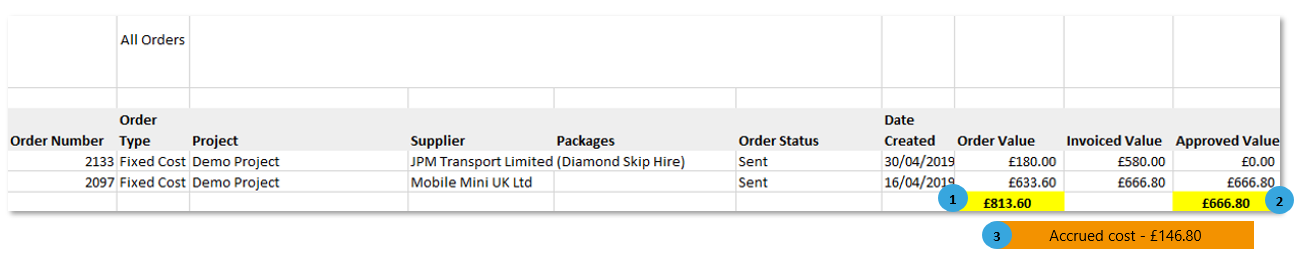
5. Example exported table below shows:
Fixed costs
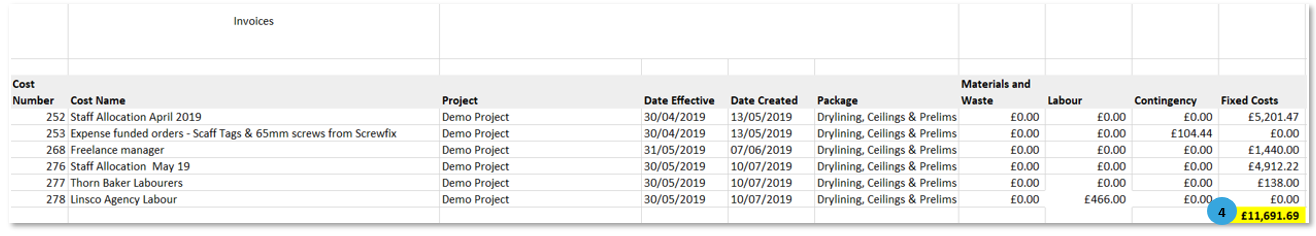
Check the figures
1. Total order value £813.60.
2. Approved value £666.80
3. Accrued cost £146.80.
4. External fixed costs £11,691.69
Cross check actual costs
The 'Last Certified Application' chart shows - actual fixed costs of £12,358.49.
The exported accounts table shows - actual approved value of fixed cost order invoices & external costs £12,358.49.
This shows there is no requirement for contingency budget.
The accrued figure is the difference between the ordered and approved values in relation to fixed cost orders. It is a prediction rather than actual manifest fact, based on best information at the time, so this figure can’t be scrutinised further.
Contingency
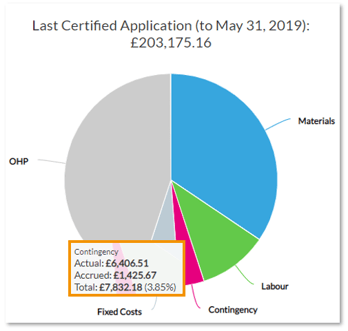
Contingency is the safety net budget that culminates expenditure to date that does not have a direct allocation within the live project scope. This is costed and accounted for in project data.
Based on this example project, the figures displaying as actual contingency costs to date are:
Material contingency - £4,877.08.
Labour contingency - £1,425.06.
External costs contingency £104.44.
Total contingency on this project - £6,406.58
The accrued value here is the difference between the ordered value of contingency items and invoiced to date value for these items.
The £0.07 difference from the figure in the 'Last Certified Application' chart is due to slight rounding anomalies in the underlying data that are inevitable. This is a projection rather than manifest fact and cannot be scrutinised any further.
